11.1 Cloud-based geospatial data processing - Basics
In this lesson, we are going to learn the basics of Google Earth Engine (https://earthengine.google.com/).
Get a quick overview
- Homepage: https://earthengine.google.com/
- A cloud-based geospatial analysis platform
- Analysis and visualisation tool
- Petabytes of organised available data
- Documentation: https://developers.google.com/earth-engine/
- Code editor: https://code.earthengine.google.com/
Examples
- Timelapse
- https://earthengine.google.com/timelapse/
- Global, zoomable videos including 34 years of cloud-free annual mosaics
- Landsat, Sentinel-2A, MODIS, ETOPO11, Hansen Global Forest Change
- Proof that the world is going to hell
Available data
- https://developers.google.com/earth-engine/datasets/
- Browse by tags: https://developers.google.com/earth-engine/datasets/tags
- Thematic fields:
- Imagery
- Geophysical
- Climate and Weather
- Surface Temperature: https://developers.google.com/earth-engine/datasets/tags/temperature
- Climate: https://developers.google.com/earth-engine/datasets/tags/climate
- Weather: https://developers.google.com/earth-engine/datasets/tags/weather
- Yes, and more...
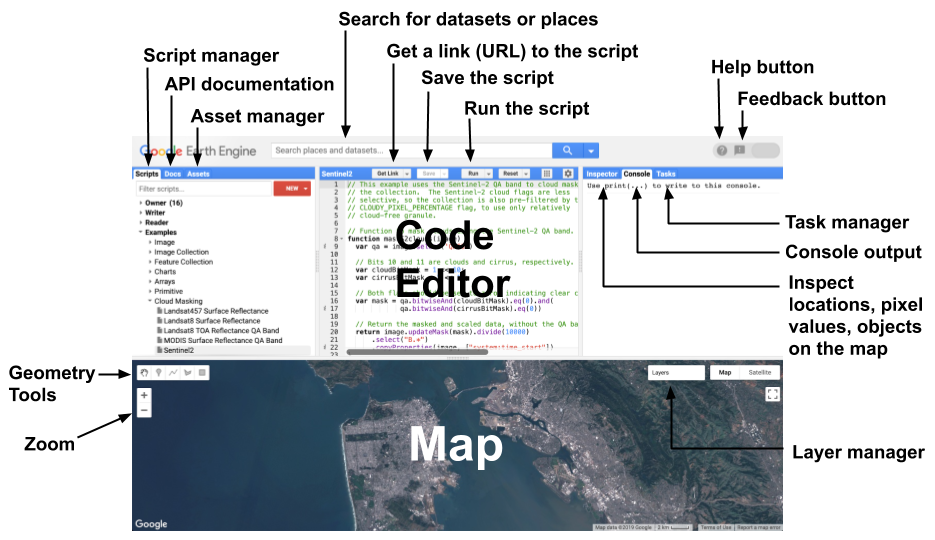
Code editor
- https://developers.google.com/earth-engine/datasets/
- Web-based IDE
- Based on Javascript
- The heart of the GEE
Javascript
A simple script in Python:
int_var = 5

print("int_var is ", int_var)

boolean_var = True;

if boolean_var is True:
    print("It is true")
else:
    print("It is not true")

list_var = [2, 3, 5, 7, 11]

print(f"second prime number is {list_var[1]}")

dict_var = {"my_key": "my_value"}

print("int_gis " + dict_var["my_key"])

def my_function(arg1, arg2):
  return arg1 * arg2

print("2 * 3 is {}".format(my_function(2, 3)))
Its alternative in Javascript:
var int_var = 5;

print("int_var is " + int_var);

var boolean_var = true;

if (boolean_var === true) {
  print("It is true")
} else {
  print("It is not true")
}

var list_var = [2, 3, 5, 7, 11];

print("second prime number is " + list_var[1]);

var dict_var = {"my_key": "my_value"};

print("int_var is " + dict_var["my_key"]);
// the next works in javascript too
print("myand this returns the same " + dict_var.my_key);

function my_function(arg1, arg2) {
  return arg1 * arg2;
}

print("2 * 3 is " + my_function(2, 3));
Javascript and its boolean conditions:
var x;

x = 0;
print(x == true);   // false, as expected
print(x == false);  // true as expected

x = 1;
print(x == true);   // true, as expected
print(x == false);  // false as expected

x = 2;
print(x == true);   // false, ??
print(x == false);  // false
Simple examples
Let's get the S2 collection and visualise the data:
var sentinel_col = ee.ImageCollection("COPERNICUS/S2_SR")
  // filter by dates
  .filterDate('2020-04-01', '2020-06-1')
  // filter for the drawn rectangle
  .filterBounds(geometry);

// add to the map window
Map.addLayer(sentinel_col, {bands: ['B4', 'B3', 'B2'], man: 0, }, 'sentinel');
Let's get the L8 collection and visualise a cloud-free mosaic. For this example, you will need to draw a geometry object first:
// it does not work with LANDSAT/LC08/C02/T1_TOA
var landsat_col = ee.ImageCollection("LANDSAT/LC08/C02/T1")
  // filter by dates
  .filterDate('2016-04-01', '2016-06-01')
  // filter for the drawn rectangle - DOES NOT WORK FOR ME FOR LANDSAT
  .filterBounds(geometry);

// composite to get rid of clouds (the function does not exist for sentinel)
var landsat_col_cloudfree = ee.Algorithms.Landsat.simpleComposite(
  {
    collection: landsat_col
  }
)

// add to the map window
Map.addLayer(landsat_col_cloudfree, {bands: ['B4', 'B3', 'B2'], min: 0, }, 'landsat');
// zoom to the thing
Map.centerObject(geometry, 10);