3. Data processing automation
Approaches:
- Graphical modelers (this lesson)
- Scripting (usually Python - next lesson)
Graphical Modeler
A Graphical Modeler in GIS is a tool that allows users to create, automate, and visualize complex geoprocessing workflows using a graphical interface instead of scripting or manual execution. It enables users to design models by connecting different GIS processes, tools, and datasets in a flowchart-like manner.
Such tools are available in most widely used platforms such as ArcGIS Pro or QGIS. In this lesson, we will demonstrate the practical tool available in GRASS GIS (https://grass.osgeo.org, another open source GIS) and ArcGIS Pro (proprietary, see lesson 1).
Task
Desing model based on lesson 2 workflow.
GRASS GIS
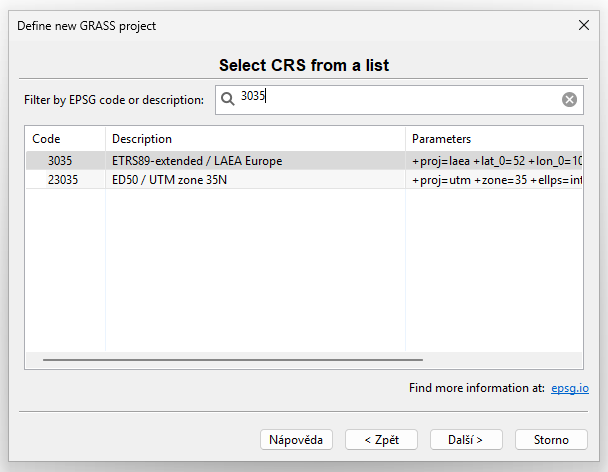
Create new GRASS project (location) in EPSG 3035:
Import DEM, LUCAS, and CORINE data. Due to the size of the dataset it is
recommended to import only data relavant to AOI. It can be done by
using v.in.ogr's -r flag which respect the current computation
region.
Now try to solve in GRASS processing workflow from lesson 2 by running GRASS tools (list below) manually.
g.regionr.mapcalc.simpler.nullr.to.vectv.extractv.clipv.bufferv.select
Based on the processed workflow, design a model using Graphical Modeler:

Note
Download GRASS GIS model v1
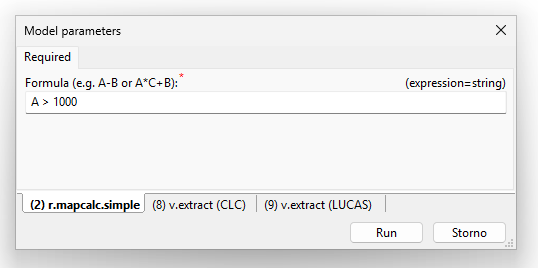
Enhanced model UI
Define model UI:
- MASL
- CLC expression
- LUCAS expression
Run parametrized model in GRASS GIS environment:
Note
Download GRASS GIS model v2
Task
Create a new mapset and run the parametrized model on different land cover class, eg. Woodland (LUCAS: lc1 LIKE 'C%', CORINE: Code_18 > 310 and Code_18 < 319).
ArcGIS Pro
Repeat the calculation in ArcGIS Pro including the model.
Basic model example:

Note
Download ArcGIS Pro ATBX
Enhanced model UI
Run parametrized model in ArcGIS Pro environment:

Task
Run the parametrized model on different land cover class.