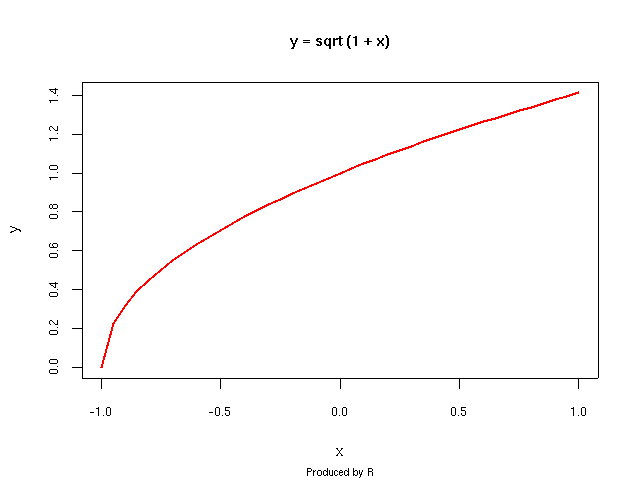
Fce y = sqrt (1+x)
x <- seq  (-1, 1, by = 0.05)
y <- sqrt (1 + x)

plot (x, y,
      type = "l", lwd = 2, col = "red",
      main = "y = sqrt (1 + x)", sub = "Produced by R",
      cex.sub = .6, cex.main = .9, cex.lab = .8, cex.axis = .75)
 Obrázek: Průběh funkce y = sqrt (1+x)